Conversion Rate Optimisation for UK Websites: From Hypothesis to Impact
18 Nov, 2025Most UK websites lose money every day-not because they have bad products, but because they don’t know how to turn visitors into customers. You might have great traffic, clean design, and solid product pages. But if just 1.5% of people buy something, you’re leaving 98.5% behind. That’s not luck. That’s a system you haven’t fixed yet.
What Conversion Rate Optimisation Really Means
Conversion rate optimisation (CRO) isn’t about making buttons bigger or changing colors just because someone said it works. It’s about understanding why people leave-and then fixing it with data, not guesswork. A UK website with a 2.3% conversion rate isn’t broken. It’s untested. The average e-commerce site in the UK converts at 2.1%, according to 2025 data from the UK Online Retail Association. But the top 10%? They hit 5.8% or higher. The difference isn’t budget. It’s process.
Every visitor who lands on your site has a job to do. Maybe they’re comparing prices. Maybe they’re scared of hidden fees. Maybe they don’t trust your delivery times. CRO finds those hidden blocks and removes them. It’s not magic. It’s measurement.
Start with a Real Hypothesis, Not a Wish
Too many teams say, “Let’s try a red CTA button.” That’s not a hypothesis. That’s a hope. A real hypothesis is testable, specific, and rooted in behavior. For example:
- “If we add live chat support during checkout, users who abandon at the delivery options page will complete 22% more purchases.”
- “If we replace the 12-point font size on our pricing table with 14-point, users will scroll past it 30% less.”
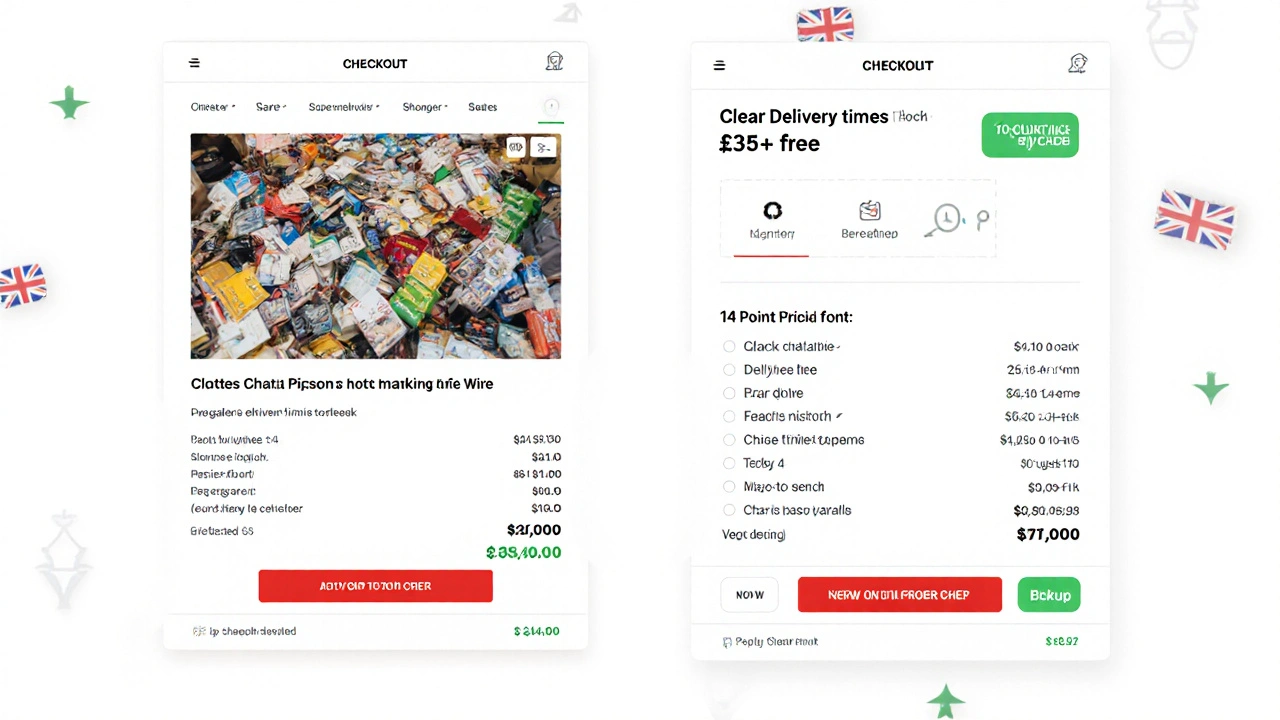
- “If we show UK delivery times upfront instead of after the cart, cart abandonment will drop by 18%.”
Notice the pattern? Each one names a change, predicts a behavior shift, and ties it to a measurable outcome. You don’t need fancy tools to write these. Just talk to your customers. Look at session recordings. Check where people click-and where they stop.
One London-based home goods brand noticed 67% of users clicked on their “Free Delivery” badge but then left. Their hypothesis? People thought “free” meant no minimum spend. They changed it to “Free delivery on orders over £35” and saw abandonment drop by 29% in two weeks.
Use Real UK Data, Not Global Benchmarks
What works in the US won’t always work in the UK. British shoppers care about different things. They’re more skeptical of flashy claims. They check reviews longer. They want clear return policies. And they hate surprise costs.
According to a 2025 survey by the UK Consumer Data Research Centre, 73% of UK shoppers say they’ve abandoned a cart because of unexpected delivery fees. Only 41% of US shoppers said the same. That’s not a small gap. That’s a strategy gap.
Don’t copy what Shopify or Amazon does. Look at what successful UK brands do. Look at John Lewis. They show delivery windows down to the hour. They list return costs upfront. They don’t hide the total until the final step. That’s not design-it’s trust-building.

Test One Thing at a Time
Some teams run A/B tests with five changes at once: new headline, different image, moved button, changed font, added trust badge. Then they say, “It went up 14%!” But which change did it? You don’t know. And now you can’t replicate it.
Every test should test one variable. One change. One hypothesis. That’s how you learn. Use tools like Google Optimize, VWO, or even free options like Optimizely’s starter plan. But don’t skip the test. Even small changes matter.
A Sheffield-based skincare brand tested two versions of their product page. One had a video. One didn’t. The video version had 12% more add-to-carts-but 18% fewer purchases. Why? The video was 90 seconds long. People watched it… then got distracted. They switched to a 30-second clip with real customer testimonials. Conversions jumped 19%.
Fix the Big Leaks First
Not all pages are equal. Some pages are leaking customers like a sieve. Others are fine. Find the leaks.
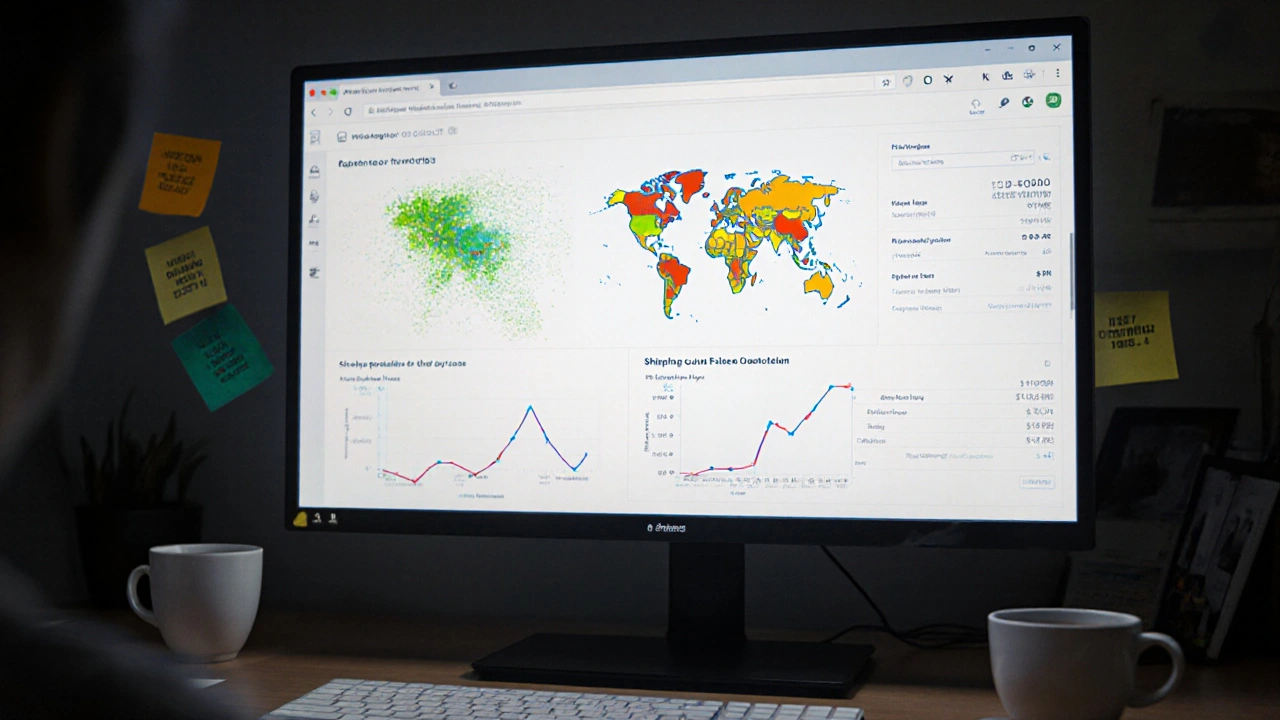
Use heatmaps (Hotjar, Microsoft Clarity) to see where people scroll, click, and stop. Use session recordings to watch real users struggle. Look for:
- People clicking on non-clickable text
- Scrolling past your main offer
- Spending 3+ minutes on the pricing page but not buying
- Leaving right after seeing the shipping cost
One Manchester-based furniture retailer found that 41% of users clicked on the “See Full Specs” link-then left. They thought it was a product detail page. It was just a pop-up. They changed it to a full page with expandable sections. Conversion on that page went up 33%.
Impact Isn’t Just About Sales
Conversion isn’t always “Buy Now.” Sometimes it’s “Sign up for the newsletter.” Sometimes it’s “Download the sizing guide.” Sometimes it’s “Watch the demo.”
Define your primary conversion goal. Then track secondary ones. A UK B2B software company saw low sign-ups on their free trial page. They tracked how many people downloaded their PDF comparison guide. That number was 5x higher than sign-ups. So they moved the guide above the fold, linked it to the trial button, and added a line: “Download our guide → See if this fits your team.” Sign-ups jumped 47%.
That’s the power of understanding the journey-not just the endpoint.

Keep Testing. Even When It’s Working
There’s no finish line in CRO. Just because your conversion rate is 4.1% doesn’t mean you’re done. Market trends change. New competitors appear. Customers get smarter. What worked last year might be ignored today.
Set a rule: test at least one thing every month. Even if it’s small. Change the wording on your checkout button. Test a different trust icon. Add a FAQ accordion. Track the result. If it moves the needle, keep it. If not, move on.
One Edinburgh-based outdoor gear brand tests one change every 30 days. They’ve been doing this for 18 months. Their conversion rate went from 1.9% to 5.2%. Not because they did one big overhaul. Because they kept asking: “What’s stopping them?”
Stop Chasing Quick Wins
There are no magic bullets. No “10 hacks to double your sales.” CRO is slow. It’s boring. It’s data. It’s patience.
But the payoff is real. A 1% increase in conversion on a site doing £500,000/month in sales = £5,000 more per month. That’s £60,000 a year. Just from testing one button.
Stop spending money on ads to fix a leaky funnel. Fix the funnel first. Then spend more on ads. That’s how the best UK brands grow.
What’s the average conversion rate for UK e-commerce sites in 2025?
The average conversion rate for UK e-commerce sites in 2025 is 2.1%, according to the UK Online Retail Association. However, top-performing sites hit 5.8% or higher by using consistent, hypothesis-driven CRO methods.
Do I need expensive tools to do CRO?
No. You can start with free tools like Google Optimize, Microsoft Clarity (for session recordings), and Hotjar’s free plan. The real cost isn’t software-it’s time. You need to analyze data, write hypotheses, and run tests. Tools just help you measure.
How long should I run an A/B test?
Run your test until you reach statistical significance-usually 1-4 weeks, depending on traffic. Don’t stop early just because one version looks better. With low traffic, you might need 6-8 weeks. Always use a sample size calculator to be sure.
Should I test on mobile and desktop separately?
Yes. Mobile users behave differently. They scroll faster, tap more accidentally, and are more sensitive to load time. A change that works on desktop might hurt mobile conversions. Always test devices separately if your traffic is split more than 30/70.
What’s the most common mistake UK businesses make with CRO?
They assume what works for big brands works for them. They copy Amazon’s layout or ASOS’s checkout flow without understanding why it works. UK customers trust clarity over flash. They want honesty, not hype. Fix your own funnel, not someone else’s.
Next Steps: Your First CRO Action Plan
Here’s what to do next week:
- Log into your Google Analytics or Shopify dashboard. Find your top landing page with the highest bounce rate.
- Watch 5 session recordings from that page using Microsoft Clarity (free).
- Write down three things users did that confused you.
- Turn one of those into a hypothesis: “If we change X, then Y will happen.”
- Set up a simple A/B test. Run it for two weeks.
You don’t need permission. You don’t need a big team. You just need to start asking: Why did they leave?” And then test the answer.
