
 by
by Sales Metrics for UK Teams: Pipeline, Win Rate, and Conversion Benchmarks
27 Apr, 2026Quick Takeaways for UK Sales Leaders
- Pipeline health is measured by coverage ratio (usually 3x to 4x target) rather than total value.
- UK B2B win rates typically hover between 20% and 30% depending on lead quality.
- Conversion rates should be tracked by stage to find exactly where deals are stalling.
- Regional trends show a preference for longer relationship-building phases compared to North American markets.
Understanding the UK Sales Pipeline
Your pipeline isn't just a list of potential deals; it's a forecast of your company's future. When we talk about Sales Pipeline is a visual representation of where prospects are in the sales process, from initial lead to closed deal. It allows managers to see if there is enough activity to hit future targets. In the UK, a common mistake is overvaluing the pipeline. Many teams list every "interesting conversation" as an active opportunity, which bloats the numbers and creates a false sense of security.
To get a real grip on your pipeline, you need to look at the Pipeline Coverage Ratio. This is the total value of your pipeline divided by your sales quota. For instance, if your team needs to close £100,000 this quarter, and your pipeline is £300,000, you have a 3x coverage ratio. In a stable UK market, 3x is often the baseline, but if you're in a high-growth sector like FinTech, you might need 4x to account for the volatility of corporate budgets.
Another critical metric is Pipeline Velocity. This tells you how fast a deal moves from the first touchpoint to a signed contract. If your average deal takes 90 days to close, but you're adding leads that typically take 120 days, you've got a timing mismatch that will lead to missed quarterly targets. Stop looking at the total sum and start looking at the flow.
Cracking the Code on Win Rates
The Win Rate is the percentage of total opportunities in a pipeline that result in a closed-won deal. It's the ultimate litmus test for your sales team's effectiveness. But here is the catch: a win rate that is too high (say, 70%) often means your team is only pursuing "easy wins" or discounting too heavily to secure the deal. Conversely, a win rate below 15% usually points to a misalignment between marketing and sales-you're chasing the wrong people.
In the UK B2B sector, a win rate of 20% to 30% is generally considered healthy. However, this varies wildly by lead source. Inbound leads (people who came to you) usually have a significantly higher win rate than outbound leads (cold outreach). If you're blending these two into one metric, you're hiding the truth. You should track them separately to see if your outbound strategy is actually working or if you're just burning through lists.
To improve this, look at your "loss reasons." Are you losing to a specific competitor consistently? Or are deals simply stalling? In the UK, "no decision" is often the biggest competitor. British buyers are historically more risk-averse than American buyers; they would rather do nothing than make a mistake. Your win rate depends on your ability to prove the cost of inaction.
| Metric | Inbound Leads | Outbound Leads | Ideal Range |
|---|---|---|---|
| Average Win Rate | 35% - 50% | 10% - 20% | 25% (Blended) |
| Conversion to Opp | 60% - 80% | 2% - 8% | Varies by Channel |
| Sales Cycle Length | Shorter (30-60 days) | Longer (90-180 days) | Industry Dependent |
Conversion Rates and the Leaky Bucket
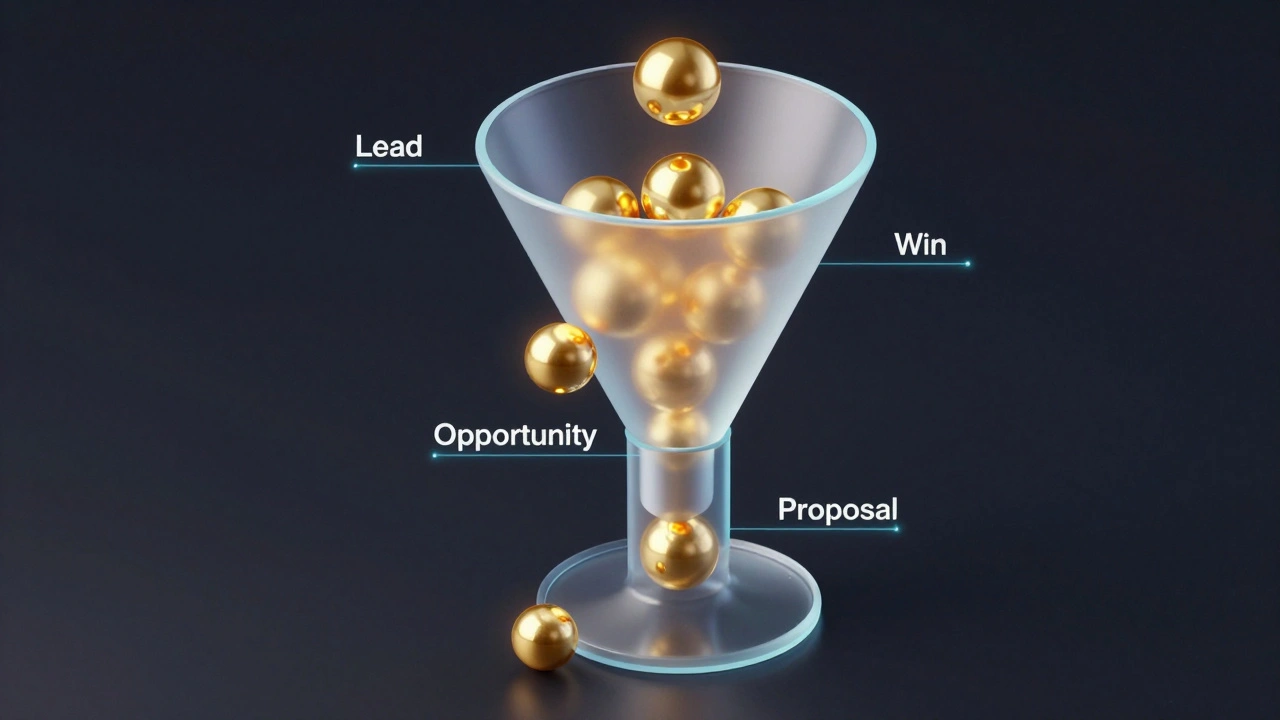
If the pipeline is the pipe and the win rate is the end result, Conversion Rate is the percentage of prospects that move from one stage of the sales funnel to the next. Most teams only track the final conversion, but the real insight is in the "micro-conversions." Where is the leak?
Let's look at a typical UK B2B journey: Lead → Qualified Opportunity → Proposal → Negotiation → Closed Win. If you have a 90% conversion rate from Lead to Opportunity, but only 10% from Proposal to Negotiation, you don't have a lead problem-you have a closing problem. You're great at getting people interested, but you're failing to demonstrate value once the price is on the table.
A common pitfall is the "Discovery Gap." This happens when a salesperson pushes a prospect to the proposal stage too quickly without fully understanding their pain points. In the UK market, rushing the relationship can be a deal-killer. High-performing teams focus on increasing the conversion rate at the Discovery stage, ensuring that only highly qualified leads reach the proposal phase. This actually lowers the total number of opportunities but increases the overall win rate.
The Relationship Between Metrics
You can't look at these numbers in isolation. They are deeply connected. For example, if you decide to increase your lead volume to hit a target, your conversion rate will almost certainly drop. This is the law of diminishing returns. If you pump 1,000 low-quality leads into your CRM (Customer Relationship Management system), your sales team will spend more time filtering noise than closing deals, and your win rate will plummet.
The goal is to find the "Golden Ratio." This is where your lead quality, pipeline volume, and win rate intersect to create predictable revenue. For a UK-based team, this often involves focusing on Lead Scoring, which is the process of assigning values to prospects based on their behavior and fit. By only moving "high-score" leads into the pipeline, you keep your conversion rates high and your sales team focused on the deals most likely to close.
Consider the impact of the Sales Cycle. In the UK, corporate decision-making often involves multiple stakeholders-procurement, legal, and finance. If your conversion rate from Proposal to Win is slow, it's likely because you haven't mapped the decision-making unit. You might have the champion (the person who wants the tool), but you don't have the economic buyer (the person who signs the check).

Common UK Benchmarking Pitfalls
One of the biggest mistakes is comparing UK metrics directly to US data. The US market is generally more aggressive and has a faster sales cadence. If you try to apply a "close fast or die" mentality to a UK account, you might alienate your prospects. The British approach to business is often more gradual, prioritizing trust and long-term reliability over immediate disruption.
Another issue is the "End-of-Quarter Rush." Many UK teams see a massive spike in conversion rates in the final week of March or September. While this looks good on a chart, it's often the result of heavy discounting or pressure tactics that can damage long-term customer retention. True health is seen in a steady, linear conversion rate throughout the quarter, not a hockey-stick growth curve that happens in the last 48 hours.
Finally, avoid the trap of "Vanity Metrics." Total pipeline value is a vanity metric. If you have £10 million in your pipeline but your average deal size is £10k and your win rate is 5%, that £10 million is a lie. Focus on sales pipeline health by looking at weighted pipeline-multiplying the value of each deal by the probability of it closing based on its current stage.
What is a good pipeline coverage ratio for a UK B2B company?
A general rule of thumb is 3x to 4x. This means if your target is £1 million, you should have £3 million to £4 million in your pipeline. This provides a safety net for the deals that inevitably fall through or get pushed to the next quarter.
Why is my win rate low despite high lead volume?
This usually indicates a "lead quality" issue. If marketing is optimizing for the number of leads rather than the quality of leads, your sales team is wasting time on prospects who aren't a fit. Implement a stricter Lead Qualification process to filter out the noise before they even hit the pipeline.
How do I calculate the conversion rate between two specific stages?
Take the number of deals that reached the second stage and divide it by the number of deals that were in the first stage. For example, if 100 deals reached the 'Discovery' stage and 30 of those moved to 'Proposal,' your conversion rate for that specific jump is 30%.
Does the industry affect these benchmarks?
Absolutely. A high-ticket enterprise software deal (six figures) will have a much lower win rate and a longer sales cycle than a low-cost monthly subscription service. Always benchmark against your own historical data and similar-sized companies in your specific vertical.
What is a 'weighted pipeline' and why should I use it?
A weighted pipeline assigns a percentage of probability to each stage (e.g., Discovery = 10%, Proposal = 50%). You multiply the deal value by this percentage to get a more realistic forecast of expected revenue, which prevents over-optimism in reporting.
Next Steps for Optimization
If you're just starting to track these, don't try to fix everything at once. Start by cleaning your CRM data. If your team isn't updating deal stages in real-time, your metrics are useless. Set a mandatory "Friday Cleanup" where every rep ensures their pipeline reflects reality.
Once the data is clean, pick one leak to plug. If your conversion from lead to opportunity is low, work with marketing to refine the target persona. If your win rate is low at the final stage, invest in sales training focused on negotiation and overcoming objections. Small, incremental gains in conversion rates across the funnel lead to massive revenue growth at the bottom.